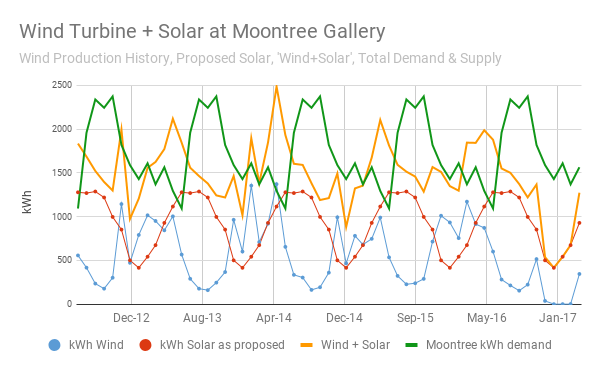
With Phase 1 solar now operational and generating good results, the Poor Handmaids of Jesus Christ with their various missions at The Center at Donaldson are wasting no time lighting up a Phase 2, some 5 times bigger (just over 500kW). The provincial and lay leadership behind this great work (and I do mean to invoke Thomas Berry!) is important in these times. More on that in future posts. Here, I wanted to look back at a particular aspect of Phase 1, something that shouldn’t be overlooked. The center’s environmental program is housed at the MoonTree Studio, where a 10kW solar array was installed in Phase 1 to go along with a previously-installed 10kW wind turbine. As we were evaluating the facilities that would make the cut in Phase 1, the overlap of solar and wind of course sparked our “microgrid imagination.” Hummmm? How perfectly would production of those two lineup so that when, say solar wasn’t producing wind was? Here’s what we estimated:

The blue line (wind- actual) and red line (solar- projected) show each technology’s individual production. We also incorporated MoonTree’s actual electric demand in the chart, shown as the green line. Wind and solar together is the orange line. Now, look at orange and green and notice that there are time periods where generation exceeds demand and vica versa. What if we could smooth that out? Well, we can.
Right now that surplus generation is net metered thanks to Northern Indiana Public Service Company (NIPSCO). In essence, the grid is providing “storage” for the surplus generation and credits back to the center that excess power when its renewables aren’t meeting demand. NIPSCO deserves credit for its net metering program. Many other utilities? Not so good and some are outright hostile.
Here’s the learning bit though– let’s start reshaping the way we think. Here we have more than a completed project. We have a learning lab. What if on-site storage (batteries) were the next technology to be added at MoonTree? Although there’s no real need for that now since NIPSCO gives the Center 1 for 1, meaning that every kWh the center puts on the grid (“banks” so to speak), NIPSCO “owes” them one. It’s a terrific economic situation for the center allowing it to get full retail value for all the power it generates. NIPSCO benefits too, since renewables like this stabilize the grid. But it’s hard to know when a utility will kill net metering. So the center could use its real-life MoonTree experience as a scenario planning exercise of sorts to look ahead to the possibility of having its own smart grid, completely self-sufficient and disconnected from the corporate grid. (See a recent AIRE working paper that touches on microgrids here.) Learnings such as this might inform new thinking and fundamentally reshape what a Phase 3 might look like, and it would help others across the country learn too.
With an exciting Phase 2 now in progress, we’ll continue to post on aspects including economics, project finance, educational, technical, and the very special leadership behind all this.
For handy archive reference to previous posts:
Last summer. See the project Phase 1 here.
Phase 1 dedication here.
A system performance report here.
The seasonal tilting of the solar panels here.
The Center’s ecological relations blog posts by Adam Thada here.